Code Project Overview
![]() This open source code project delivers a simple metadata driven processing framework for Azure Data Factory (ADF). The framework is delivered by coupling ADF with an Azure SQL Database that houses execution stage and pipeline information that is later called using an Azure Functions App. The parent/child metadata structure firstly allows stages of dependencies to be executed in sequence. Then secondly, all pipelines within a stage to be executed in parallel offering scaled out control flows where no inter-dependencies exist for a given stage.
This open source code project delivers a simple metadata driven processing framework for Azure Data Factory (ADF). The framework is delivered by coupling ADF with an Azure SQL Database that houses execution stage and pipeline information that is later called using an Azure Functions App. The parent/child metadata structure firstly allows stages of dependencies to be executed in sequence. Then secondly, all pipelines within a stage to be executed in parallel offering scaled out control flows where no inter-dependencies exist for a given stage.
The framework is designed to integrate with any existing Data Factory solution by making the lowest level executor a stand alone processing pipeline that is wrapped in a higher level of controlled (sequential) dependencies. This level of abstraction means operationally nothing about the monitoring of orchestration processes is hidden in multiple levels of dynamic activity calls. Instead, everything from the processing pipeline doing the work can be inspected using out-of-the-box ADF features.
This framework can also be used in any Azure Tenant and allow the creation of complex control flows across multiple Data Factory resources by connecting Service Principal details to targeted Subscriptions > Resource Groups > Data Factory’s and Pipelines, this offers very granular administration over data processing components in a given environment.
Thank you for visiting, details of this latest release can be found below.
ADF.procfwk content and resources:
| Blogs | mrpaulandrew.com/ADF.procfwk | |
| GitHub | github.com/mrpaulandrew/ADF.procfwk | |
 |
#ADFprocfwk |
Version 1.5 of ADF.procfwk is ready!
Release Overview
 The primary addition in this release of the processing framework is a new Power BI dashboard to display an overview of all executions. That said; I have to confess that creating pretty things in Power BI isn’t my strength, but still wanted to add some reporting capabilities for other people using the framework in real world solutions. Hopefully this dashboard provides a starting point in terms of the model created and the underlying database views. Then feel free to create things much better looking than my example dashboard 🙂
Firstly, to create something meaningful to report on I left the framework running in my test environment for about a week being triggered every 2 hours by a separate caller Data Factory. I also used a stored procedure to randomly set the Worker pipeline Wait activities to different durations to give some variety to the metrics. You can see in the dashboard I racked up 90 executions of framework with only a handful of intentional failures to capture restarts in the reporting. If nothing else I hope this demonstrates a good amount of resilience in the framework boiler plate code.

Before diving in the reporting parts, let’s just call out a few other changes and fixes…
Bug Fixes
The following procedures are now correctly capture the [CallingDataFactoryName], [ResourceGroupName] and [DataFactoryName] attributes in the table [procfwk].[ExecutionLog]. Previously, these values were being set to the table defaults of ‘Unknown’ as the procedure INSERT statements hadn’t been updated. Thank you Marc van der Wielen for reporting this bug 🙂
[procfwk].[UpdateExecutionLog][procfwk].[SetLogActivityFailed]
Database Changes
The main database changes in this release relate to the new views that support the Power BI dashboard visuals. Building on the views created in the previous release we now also have the following:
[procfwk].[LastExecutionSummary]– These views groups the last execution record to offer a wall clock duration in minutes from the first logged start time to the last logged finish time.[procfwk].[WorkerParallelismOverTime]– This view is probably the most complex in terms of common table expressions used and the inclusion of a numbers table. The output provides a minute by minute view on what Worker pipelines were executing at a given point per execution ID. More details below when this is visualised in the Power BI dashboard.
In addition to the new views that support the Power BI dashboard; the Run ID of the pipeline as provided by Data Factory is now persisted in the database within the attribute [AdfPipelineRunId]. This is captured from the output of the Execute Pipeline Function in the Child pipeline and persisted into the [procfwk].[CurrentExecution] table. Then moved into the long term [procfwk].[ExecutionLog] table. At deployment time I’ve also added pre and post deployment scripts to backup existing log data just incase its required and to avoid any data loss when the Execution Log table is altered. In a later release I’m planning to use this Run ID value to report Worker pipeline error details.
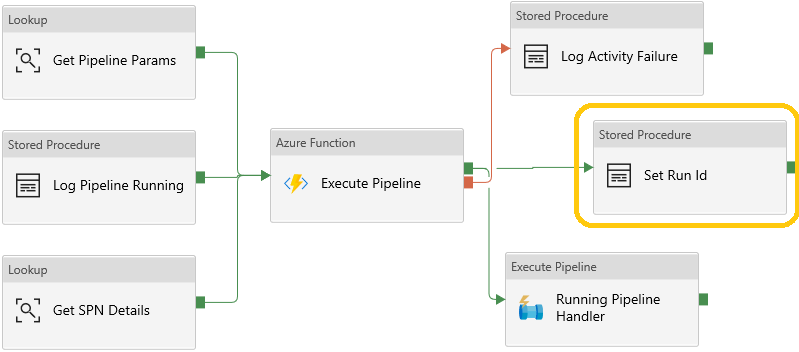
Data Factory Changes
The only significant Data Factory change in this release has been to add a stored procedure activity to the Child pipeline for the purposes of capturing the pipeline Run ID as detailed above in the Database Changes section. Below is a snippet of the Activities from inside the Child ForEach iterator. The full Activity chain picture has also been updated in the code repository PowerPoint file if you’d like a fresh view of everything in v1.5 of the framework.
Reporting Changes
I’ll leave this new ‘reporting changes’ section as a regular feature in future the release notes. Power BI is the obvious choice for this. However, I’d be open to having a play with other dashboarding tools under the processing framework banner. After all, the data source is only a SQLDB, if the model matures enough I might prompt it to its own Analysis Service instance, but baby steps for now.
Within the code repository I’ve echoed this ‘reporting’ structure with logical folders in the Solution. I’ve added both the PBIX file and a PBIT file depending on which you’d prefer to use. In either case, the connection string details will need updating.
Model
Below you can see the model I’ve created for the execution overview dashboard. This uses a combination of views and tables from the database with appropriate relationships in place to support dashboard interactions. Currently the model is setup in direct query mode, this is basically to avoid all the data from my development environment being added to the GitHub repository via the PBIX file. This would of course perform much better when using import mode so I recommend taking a copy of the Power BI file and making this change, especially if you have a lot of execution runs.
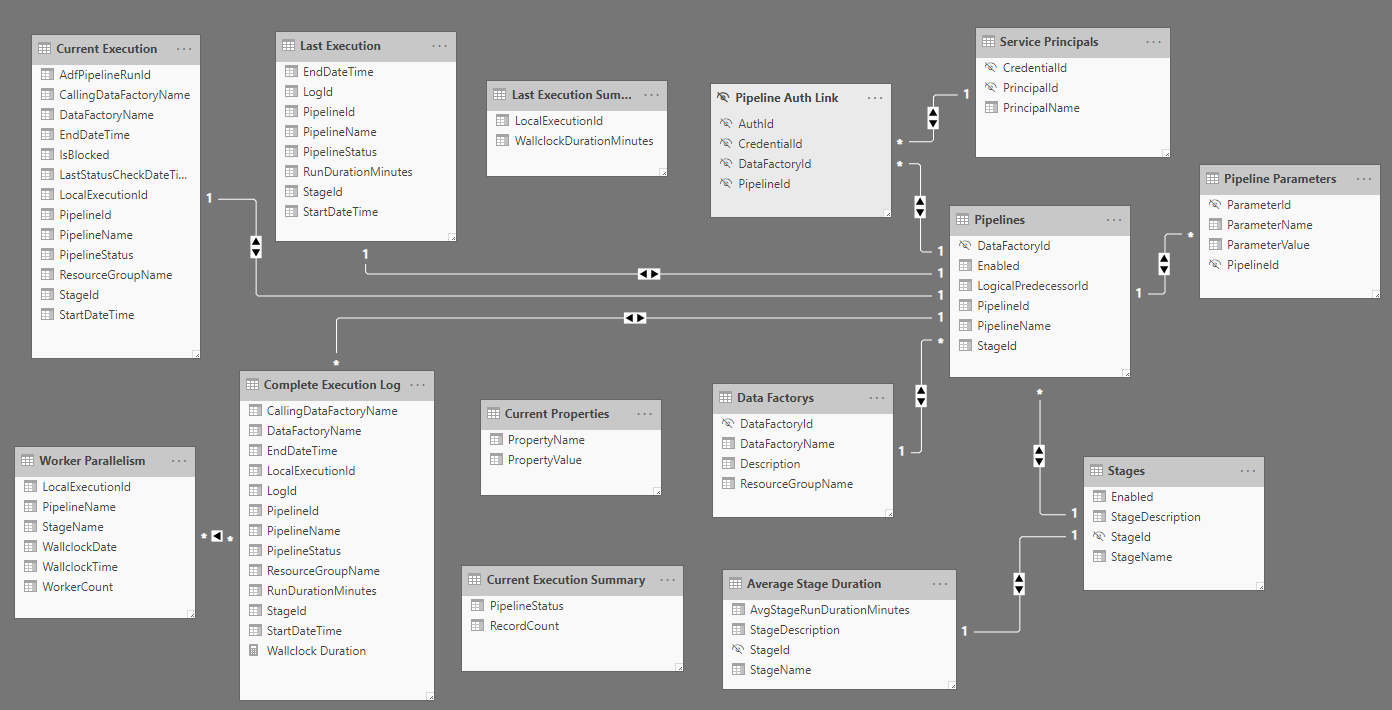
You’ll notice that I’ve hidden a lot of the ID fields from the report view in an attempt to keep things clean.
Dashboard
The dashboard I hope is fairly self explanatory in terms of metrics and the aggregations represented on the various bar charts. The colour theme is the default, I did nothing here to make it pretty. But, also understand the default in Power BI to be friendly for those that are colour blind, no reds and greens 🙂
The visual that might not be obvious is what I’ve called ‘Worker Parallelism Over Time’. This area chart required an artificial numbers table in the database (created by cross joining sys.columns) to give us a minute by minute X axis on the chart for a given execution run. Then in the plot area we can see what Worker pipeline(s) are running using that wall clock time line/X axis. We know from the metadata the number of Worker pipeline registered to a given execution stage, but this chart now shows the same in terms of actual time durations each Worker. To improve this area chart I’ve also added a tooltip that lists the stage name and pipeline name(s) at each point. The underlying database view manages this for the pipeline by using the fairly new T-SQL STRING_AGG function, very handy.
Note; the visual ‘Worker Parallelism Over Time‘ only makes sense if you select a single execution from the Execution Run’s chart above as in the model a many to many relationship current exists here.

Other Changes
A few very minor things to call out in this release:
- The Azure Resource Group Name is now included in the body request validation block for all Azure Functions. Not sure why this was missed, maybe a typo.
That concludes the release notes for this version of ADF.procfwk.
Please reach out if you have any questions or want help updating your implementation from the previous release.
Many thanks

Hi Paul,
I wanted to test this framework and i’m having strange issue.
I managed to import everything to my testing resource group but when i triggered pipline i have this error on child level:
errorCode”: “3608”,
“message”: “Call to provided Azure function ” failed with status-‘InternalServerError’ and message – ‘Invoking Azure function failed with HttpStatusCode – InternalServerError.’.”,
“failureType”: “UserError”,
“target”: “Execute Pipeline”,
“details”: []
}
I noticed, that input for executePiplineV2 is like this;
{
“functionName”: “ExecutePipelineV2”,
“method”: “POST”,
“headers”: {},
“body”: “\n{\n\t\”tenantId\”: \”1234-25cf-4d8b-a011-\”,\n\t\”applicationId\”: \”\”,\n\t\”authenticationKey\”: \”\”,\n\t\”subscriptionId\”: \”1234-124\”,\n\t\”resourceGroup\”: \”ADF.procfwk\”,\n\t\”factoryName\”: \”FrameworkFactory\”,\n\t\”pipelineName\”: \”Wait 4\”,\”pipelineParameters\”: {\”WaitTime\”: \”657\”}\n}”
}
What’s strange, in my supporting DB i changed resource group and factory name to mine.
Do you know what may be wrong?
(Also, im completly new to functions so maybe i did something wrong there but i think all should be fine)
Thanks in advance
Maciej
LikeLike
Okay, so i don’t know why item().DataFactory name shows not my ADF but anyway manged to replace that.
However function now returns error:
The client ‘idNumber’ with object id ‘TheSameIdNumber’ does not have authorization to perform action ‘Microsoft.DataFactory/factories/pipelines/createRun/action’ over scope ‘/subscriptions/{subNumber}/resourceGroups/MRPartnerResourceGroup/providers/Microsoft.DataFactory/factories/ADFprocfwkMR/pipelines/Wait 2’ or the scope is invalid. If access was recently granted, please refresh your credentials.
Maybe can you direct me what may be wrong?
I’m little bit lost around all these priviliges secrets and keys right now 🙂
LikeLike
Hey, it sounds like an authentication issue. Check ADF has permissions to Key Vault and check the Key Vault has a valid key for the Functions App.
LikeLike
I found issue, i had to add registered app into access control list.
anyway, piplines are executing but somehow now check pipelines status is resulting with bad requested
Executed ‘CheckPipelineStatus’ (Failed, Id=9219e1a4-bb00-4a1e-8459-b7fb0ed4ec91)
Error
2020-05-08 14:36:15.439
Operation returned an invalid status code ‘BadRequest’
{
“functionName”: “CheckPipelineStatus”,
“method”: “POST”,
“headers”: {},
“body”: “\n{\n \”tenantId\”: \”{ID}\”,\n \”applicationId\”: \”{ID}\”,\n \”authenticationKey\”: \”{key}-\”,\n \”subscriptionId\”: \”{SUBID}\”,\n \”resourceGroup\”: \”MRPartnerResourceGroup\n\”,\n \”factoryName\”: \”ADFprocfwkMR\”,\n \”pipelineName\”: \”Wait 10\”,\n \”runId\”: \”2ad6fe15-b5b7-4f69-93a0-2b81259f768b\”\n}”
}
and this is strange since now connections and authentications works fine and im stuck on this.
Overall i really like solution so far, just need to get everything to wrok and i will suggest to deploy it to my client 🙂
Thanks Maciej
LikeLike
Have you published the Data Factory and all the worker pipelines?
LikeLike
Yup,
They are working fine, the only error i got is from Get Pipline Status
LikeLike
I’ve managed to solve this issue by replacing dynamic resource group name passing in POST to function.
If i replaced with static name it’s working.
I don’t know why but item().DataFactoryName and item().ResourceGroupName are returning yours values.
Is there way to change that? Don’t know how they are loaded there in first place since i can’t find single place where they are set.
But yeah, it’s working now 🙂
LikeLike
They are set in the metadata table [DataFactorys].
LikeLike
Hi
“They are set in the metadata table [DataFactorys].”
-> apparently there is caching somewhere because I don’t have this entry in MetadataDB.
I managed to get everything to work, but i think it’s work to note.
LikeLike
Is the version of your database out of sync with the version of your data factory in terms of the framework solution.
LikeLike