Code Project Overview
![]() This open source code project delivers a simple metadata driven processing framework for Azure Data Factory (ADF). The framework is made possible by coupling ADF with an Azure SQL Database that houses execution stage and pipeline information that is later called using an Azure Functions App. The parent/child metadata structure firstly allows stages of dependencies to be executed in sequence. Then secondly, all pipelines within a stage to be executed in parallel offering scaled out control flows where no inter-dependencies exist.
This open source code project delivers a simple metadata driven processing framework for Azure Data Factory (ADF). The framework is made possible by coupling ADF with an Azure SQL Database that houses execution stage and pipeline information that is later called using an Azure Functions App. The parent/child metadata structure firstly allows stages of dependencies to be executed in sequence. Then secondly, all pipelines within a stage to be executed in parallel offering scaled out control flows where no inter-dependencies exist.
The framework is designed to integrate with any existing Data Factory solution by making the lowest level executor a stand alone Worker pipeline that is wrapped in a higher level of controlled (sequential) dependencies. This level of abstraction means operationally nothing about the monitoring of orchestration processes is hidden in multiple levels of dynamic activity calls. Instead, everything from the processing pipeline doing the work (the Worker) can be inspected using out-of-the-box ADF features.
This framework can also be used in any Azure Tenant and allow the creation of complex control flows across multiple Data Factory resources by connecting Service Principal details through metadata to targeted Subscriptions > Resource Groups > Data Factory’s and Pipelines, this offers very granular administration over data processing components in a given environment.
ADF.procfwk Resources
| Blogs | mrpaulandrew.com/ADF.procfwk | |
| GitHub | github.com/mrpaulandrew/ADF.procfwk | |
 |
#ADFprocfwk | |
| Vlogs | youtube.com/mrpaulandrew |
Thank you for visiting, details on the latest framework release can be found below.
 With my processing framework for Azure Data Factory now fairly well established and in implemented in a dozen different places both internally and externally I decided it was time to do some more negative testing to try and break it. For this post I’ve focused this testing on the scale out capabilities of the Worker pipelines within each execution stage.
The Child level ForEach Activity is key to this and using Data Factory’s parallel iteration behaviour allows Workers to be called in parallel. In release v1.7 I’d set this Activity batch count to 40 allowing Workers to scale out beyond the default batch size of 20 iterations. I have to confess in my development environment with only 12 Worker pipelines across 4 execution stages I never get close to this limit. In a couple of customer instance we have, but still not hitting the service maximum.
Side note; while dreaming up this test, I also confess that I did get totally carried away with the film ‘300’. For some reason I find playing around in photoshop relaxing! 🙂
Anyways, moving onto the scale out testing…
Setup
 What I did in my testing environment (also now running v1.7 of the framework):
- Created a new template Worker pipeline containing a single Wait Activity with a pipeline parameter called ‘WaitTime’ to pass to the Wait duration.
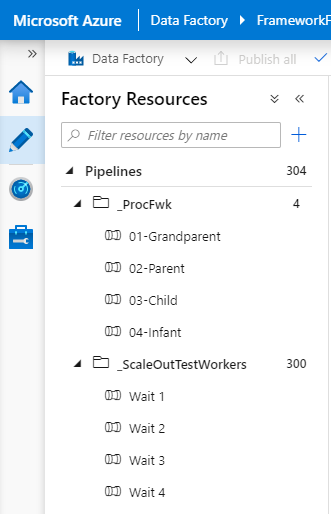
- Deployed 300 new Worker pipelines using PowerShell to edit and deploy the JSON from a single template file.
- Cleared down the majority of my test environment metadata and using a numbers table added 300 pipeline records. These were separated across 3 execution stages, 100 Workers per stage.
- Added 300 pipeline parameters with a random 3 digit wait value for the Workers.
- Updated the pipeline authentication link table so each Worker had an SPN that could be executed at runtime.
- Changed my Child pipeline ForEach batch count to use the ADF service maximum of 50 parallel iterations.
What I didn’t do in my testing environment:
- Change the Azure Function App or App Service Plan in anyway from the default ‘Consumption Tier‘ configuration.
- Scale up the Azure SQLDB. It was left as an S1 with 20 DTU’s.
I knew from the development work done that the functions code and metadata stored procedures were light weight. But just how light was the first question I wanted to answer. Secondly, would Data Factory be happy having the wheels spinning on 50 Worker pipelines all at once. Plus, 50 Infant pipelines spawned (1 per Worker) to monitor there running/completion state.
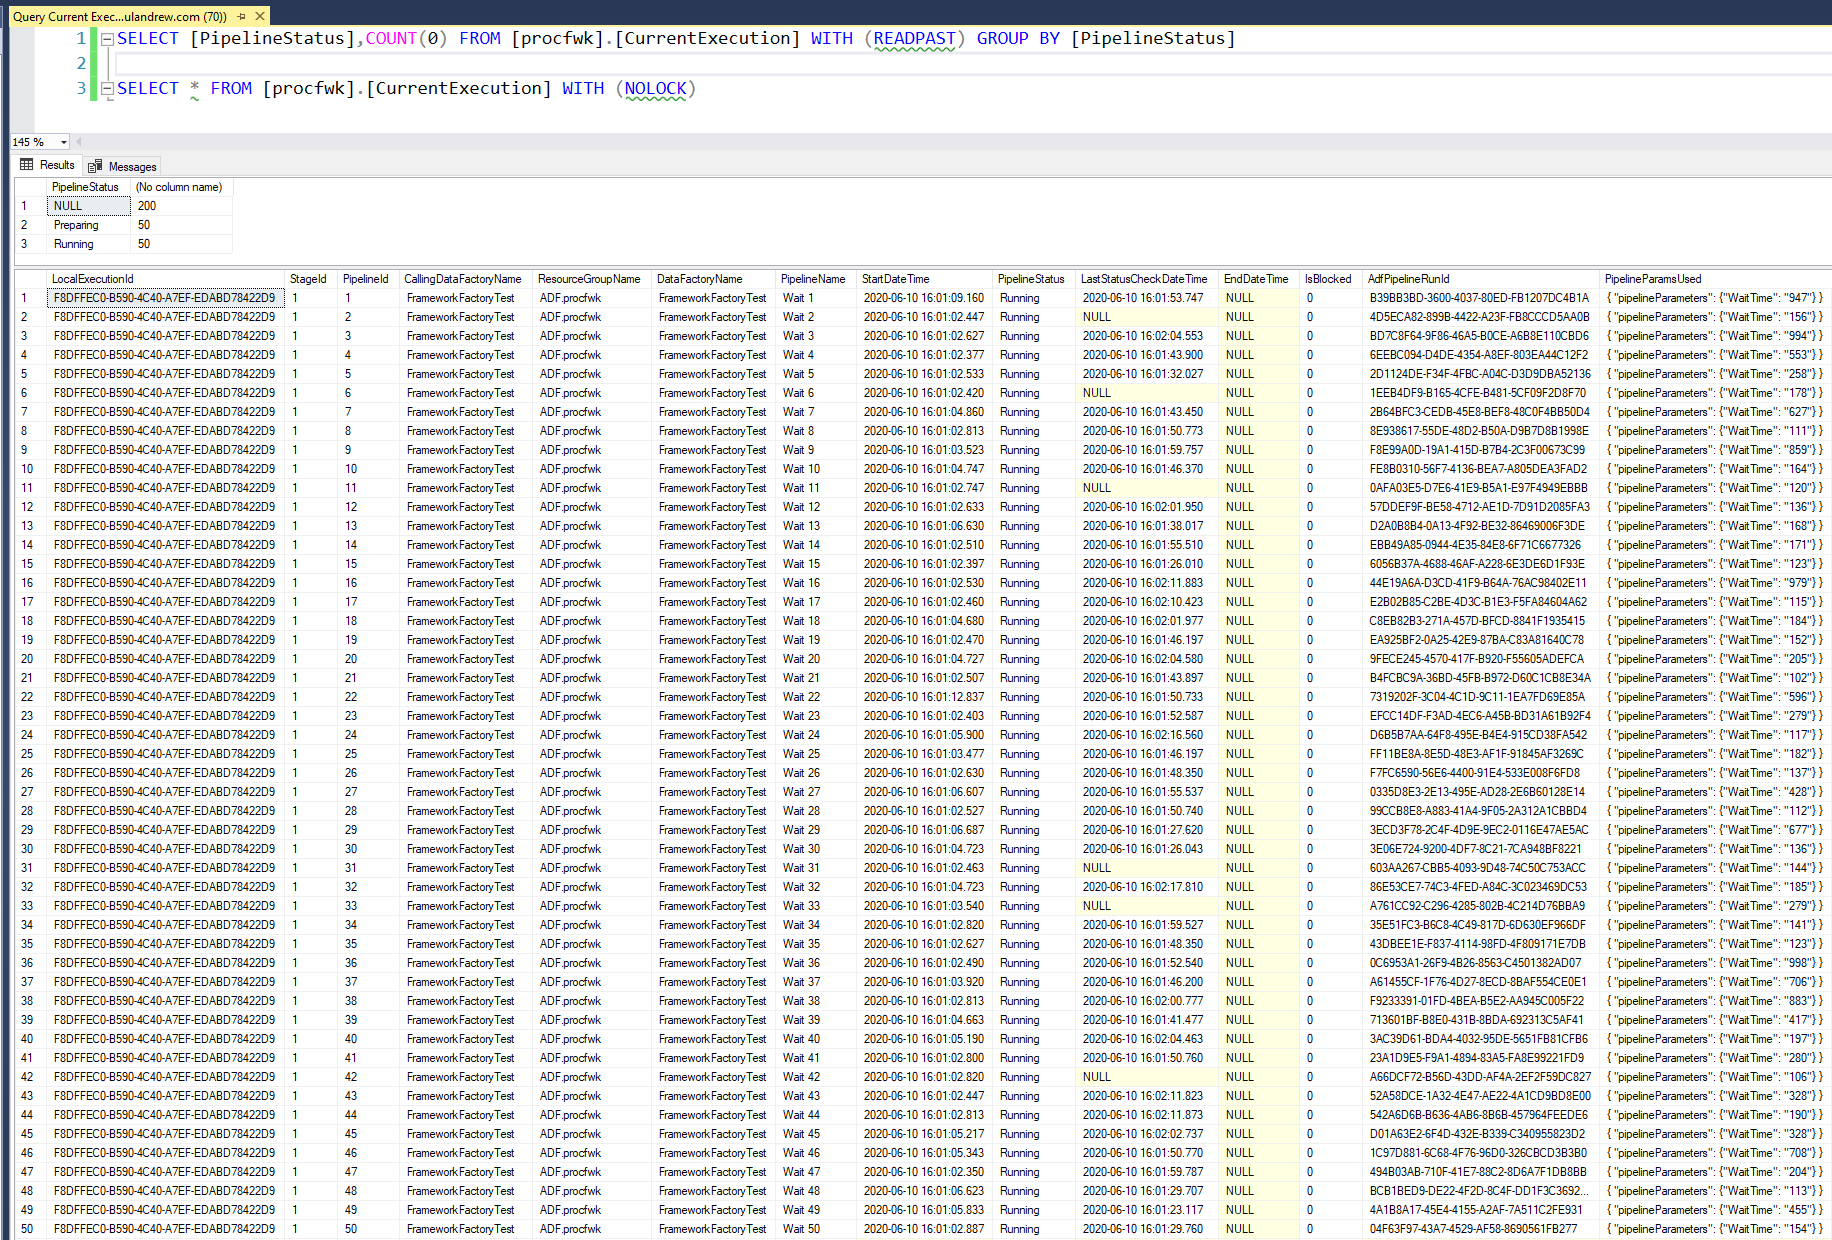
Having kicked things off the [CurrentExecution] table in the SQLDB was populated and sure enough 50 Worker pipelines began running.
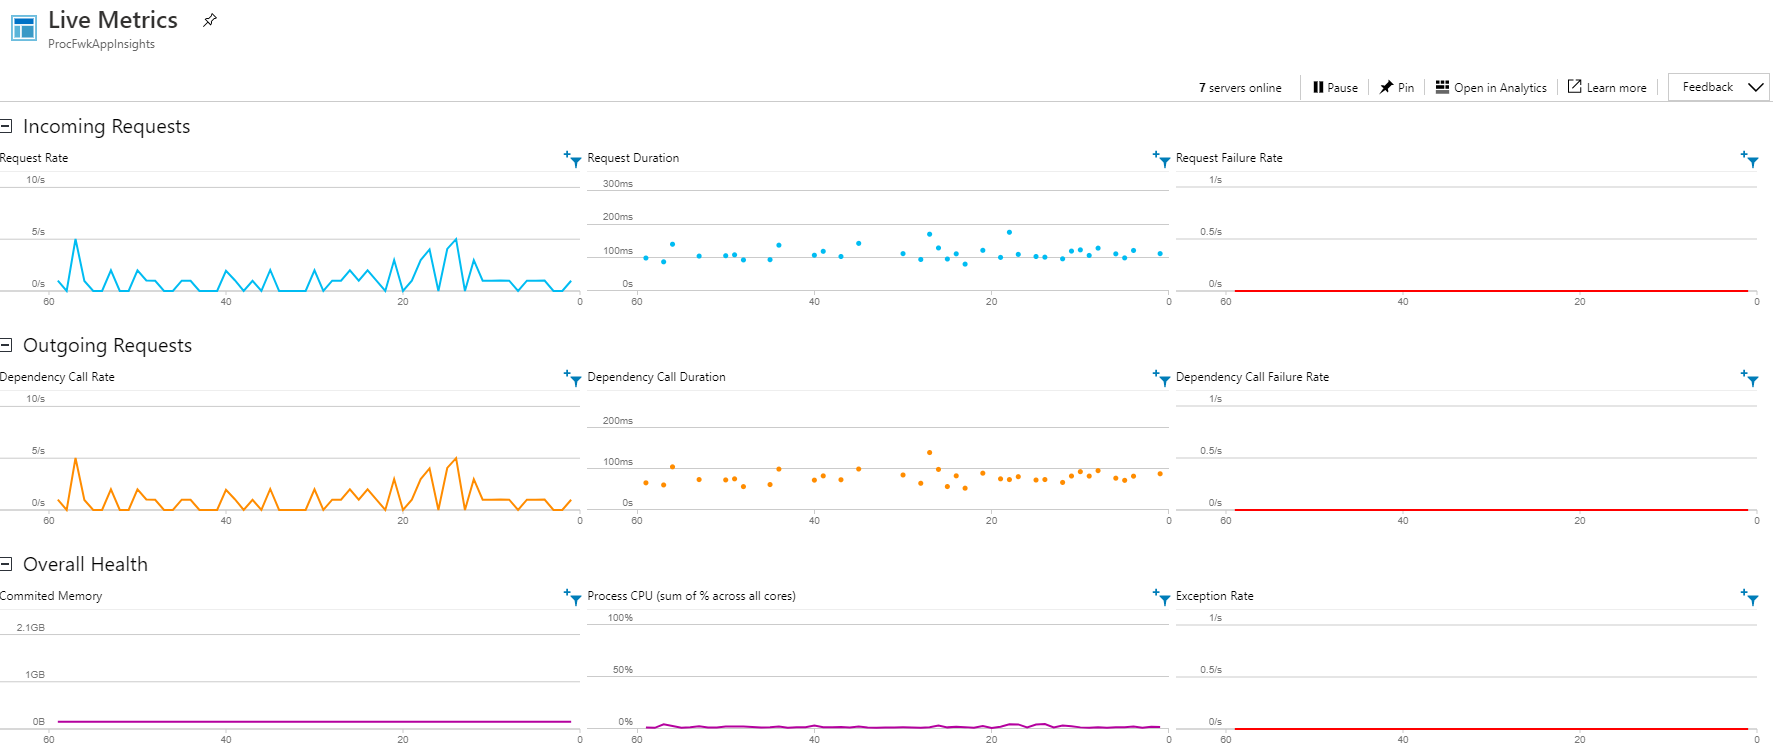
As well as the database tables I also setup my Azure Functions App to output to Application Insights so was able to see a live dashboard of Function requests.
Now, its probably worth saying that in the past I’ve done some crazy things in Data Factory with nested levels of ForEach Activities to scale out pipelines to 2500 parallel iterations. Therefore, in this solution of 100 things happening at once I wasn’t expecting many fireworks.
Outcome
Having watched the Workers and the platform for several hours having kicked off multiple processing runs I can happily report that the platform, the framework, the functions and the database didn’t even break into a sweat!
- The Functions App Service spun up 7 underlying severs to handle the requests and coped with everything that was asked of it with request durations staying below 200ms. Shown in the screen shot above.
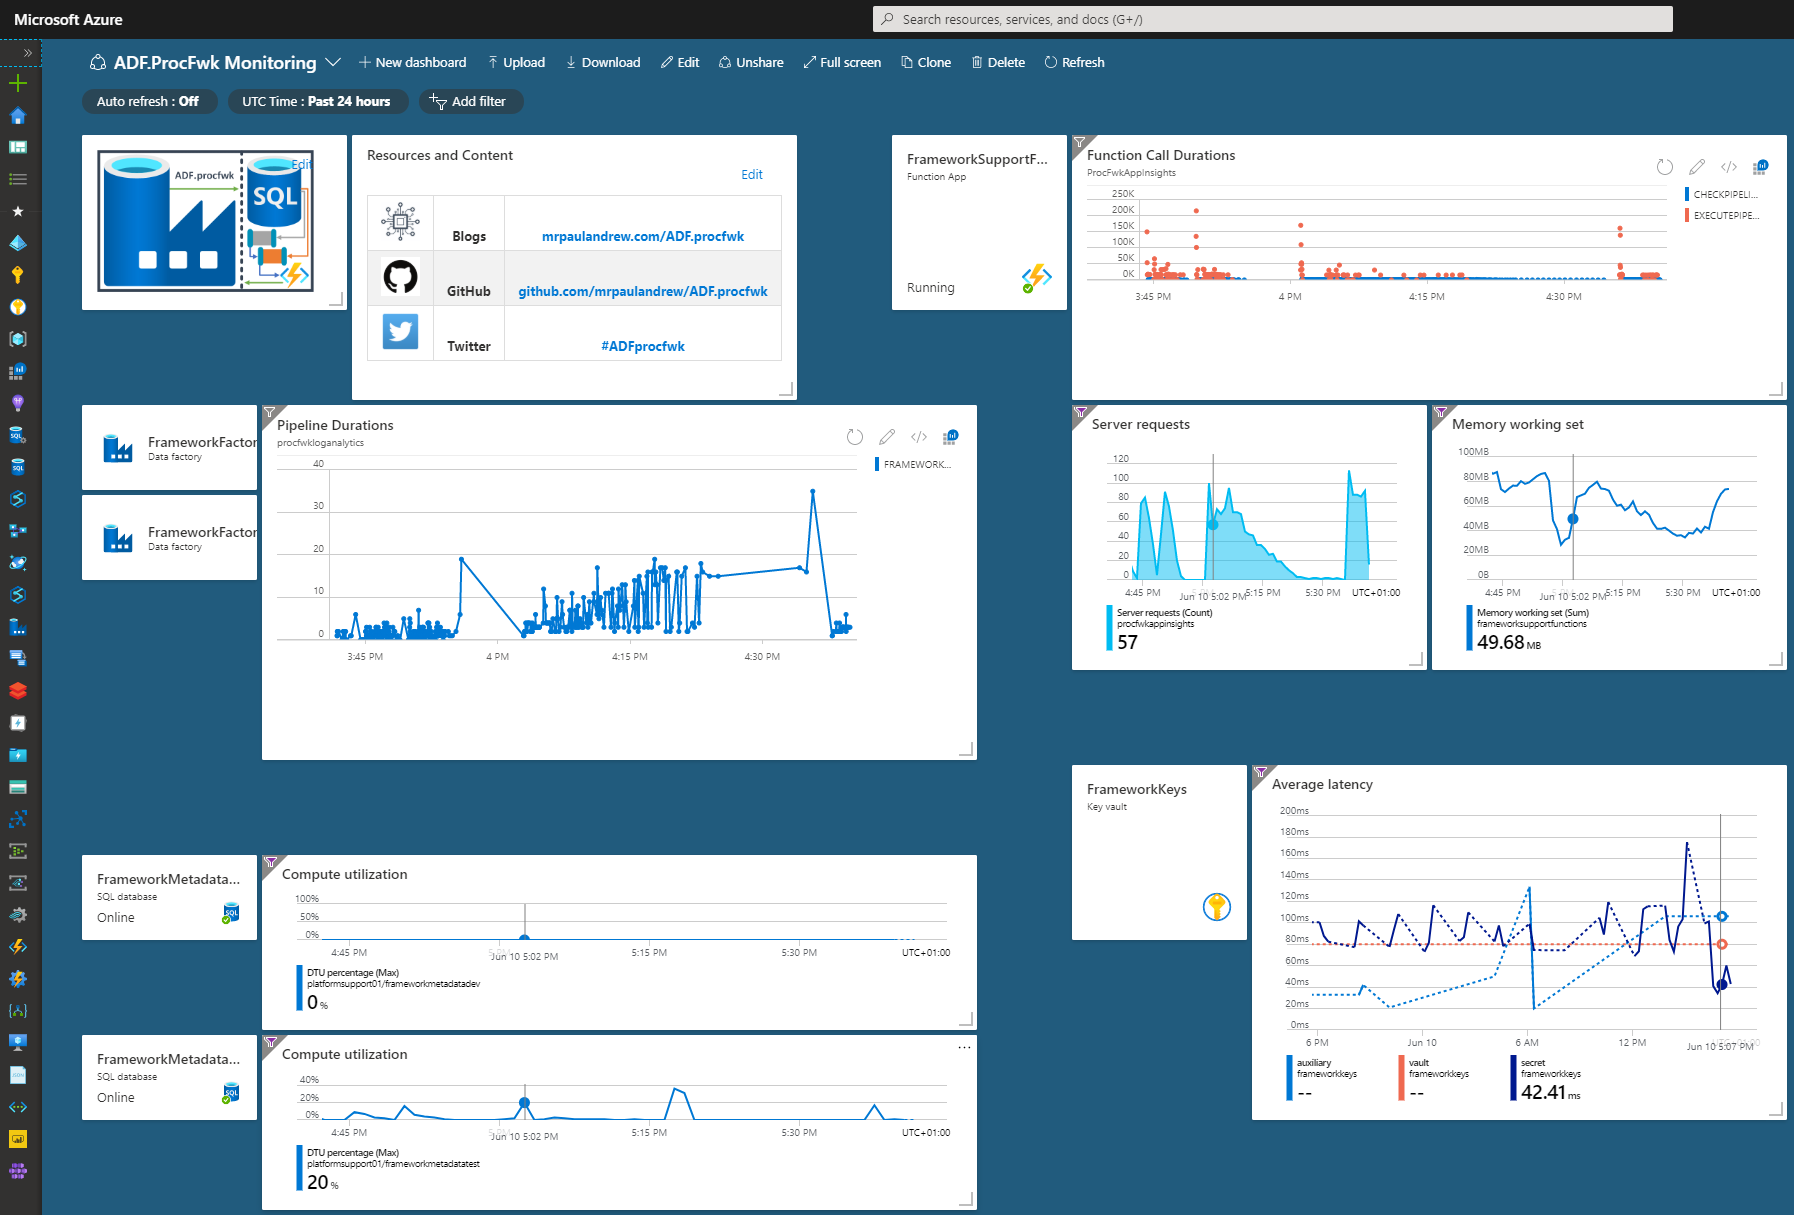
- During the peeks in processing when an execution stage ramped up the database CPU never exceeded 50% usage. Only a few spikes in compute appeared when Data Factory was requesting and updating the table for each new execution stage.
Below is a custom Azure Portal dashboard I created to allow the side by side monitoring of all resources used by the ADprocfwk.
Sadly I can’t share this dashboard setup as source code. However, what you can view is the Worker Parallelism visual in the Power BI execution overview dashboard. This nicely shows the scaled out Worker pipelines running and then completing as the execution stages finishes.
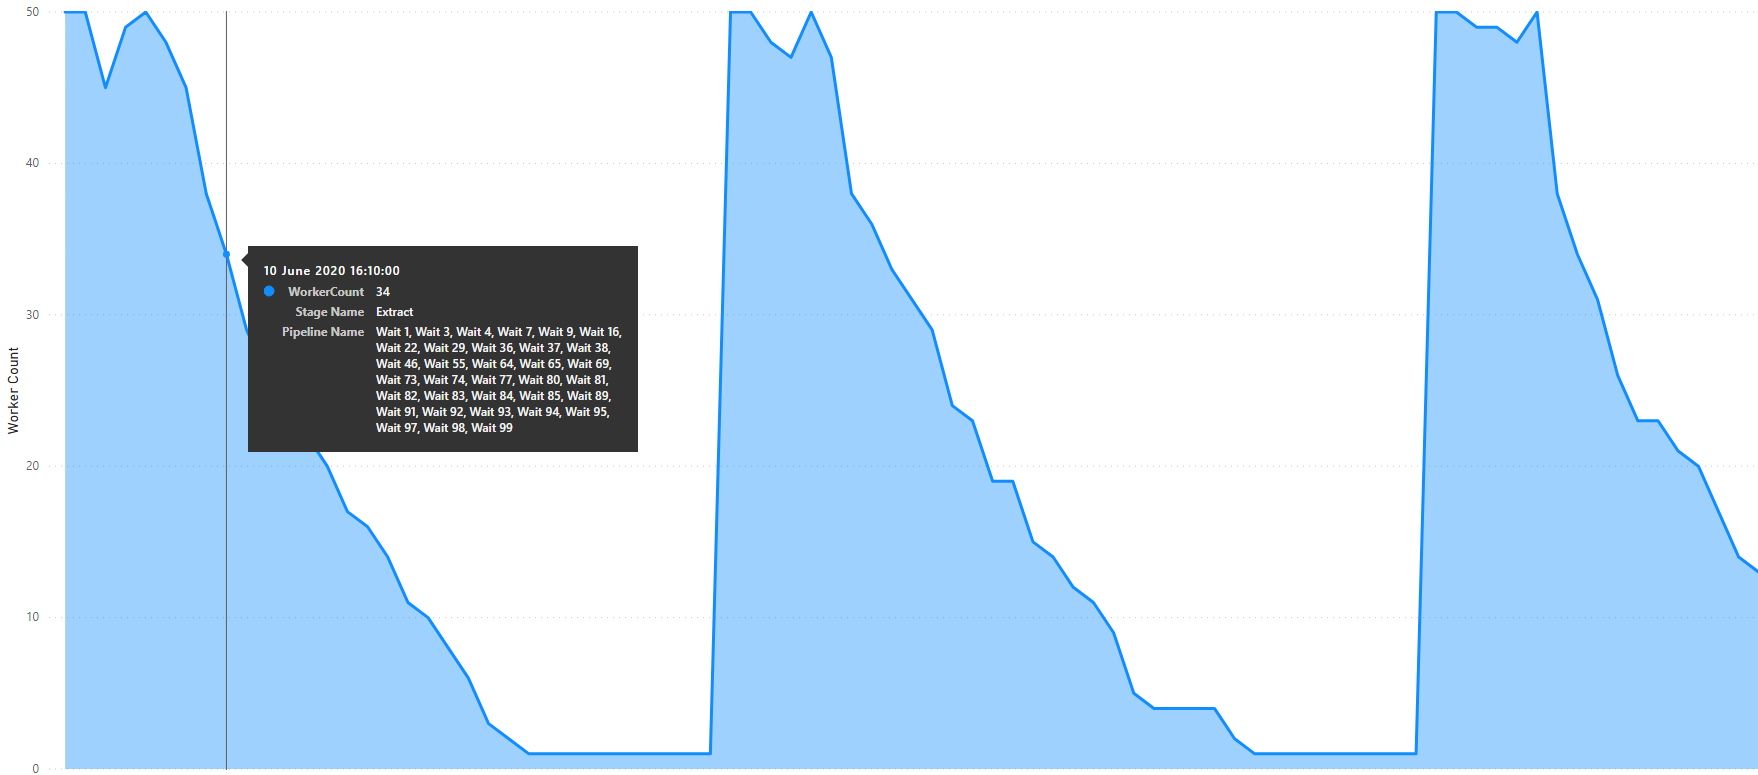
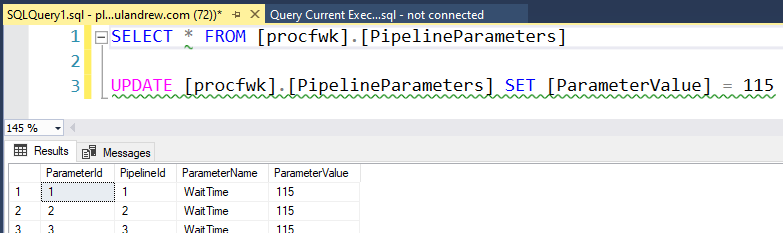
As the Worker were all passed random Wait duration values its hard to see how Data Factory deals with the ForEach Activity iterations beyond the maximum batch count of 50. Therefore, I decided to repeat the test using a constant wait duration of 115 seconds all Worker pipeline parameters. The rational being, just under 2mins for the Workers to run, and 30 seconds between iterations for the Infant checks.
The Worker Parallelism plot for that showed the following.
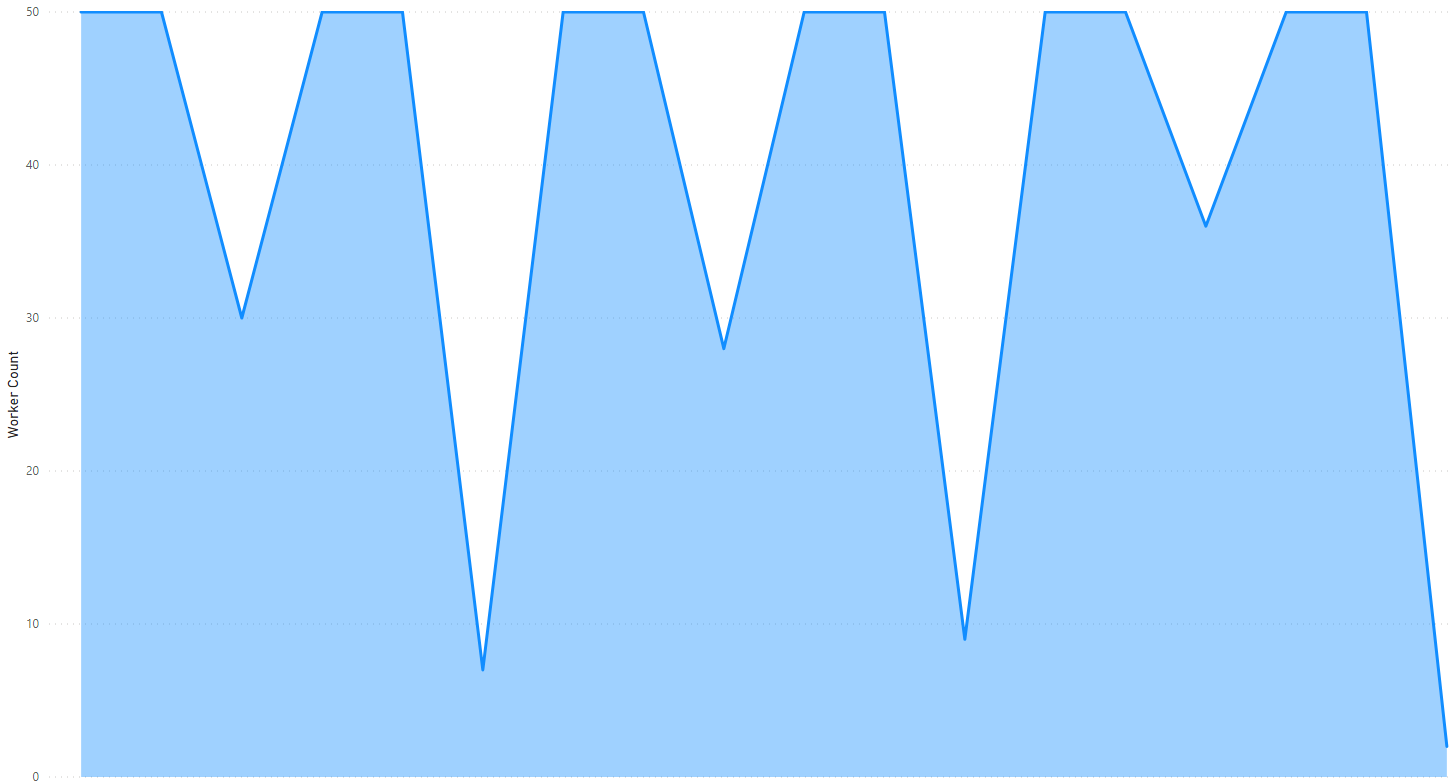
Very neat and consistent across all 3 execution stages. But we don’t have perfect batches of 50 Workers completing and another 50 starting within the same execution stage. Close though. There is always something running, we never get to 0 between stages or between batches.
Conclusion
Test passed! The framework can easily handle the maximum amount of scaled out processing allowed by the Azure orchestration resource with simple Worker pipelines being called within the same Data Factory as the Core pipelines. Furthermore, the light weight support resources (Azure Functions & Azure SQLDB) don’t need to be scaled up to deliver this scaled out orchestration and can remain on low cost service tiers.
Finally, for execution stages containing more than 50 Worker pipelines, after the initial wave of parallel iterations. Subsequent parallel calls don’t spawn in the same clean and consistent way with sight delays between each as threads (pipelines) tail off and get cleaned up. Although a high level of parallelism is still maintained for the duration of any given execution stage.
Code
If you’d like to do this as well to see the results for yourself, I’ve added the code I used to create the Workers and modify my database metadata to my Blog Support repository. Details below.
Blog Supporting Content in my GitHub repository:![]()
https://github.com/mrpaulandrew/BlobSupportingContent/{Blog_Title}
If you have any other ideas for stress testing the framework I’d be keen to hear your thoughts and implement the use case.
Many thanks for reading
